
Contents
| Image | Title | Category | Type | Description | Updated |
|---|---|---|---|---|---|
| Parallelization and heterogeneous computing: from pure CPU to GPU-accelerated image processing | Training Material | A lecture about challenges and solutions for GPU-accelerating bio-image analysis workflows and running them in the cloud. |
04/29/2023 - 10:11 | ||

|
Fractal | Software | Collection | Fractal is a framework to process high-content imaging data at scale and prepare it for interactive visualization. Fractal provides distributed workflows that convert TBs of image data into OME-Zarr files. |
04/29/2023 - 14:45 |
| Fractal: A framework for processing OME-Zarr high content imaging data | Training Material | Fractal is a framework to process high-content imaging data at scale and prepare it for interactive visualization. Fractal provides distributed workflows that convert TBs of image data into OME-Zarr files. The platform then processes the 3D image data by applying tasks like illumination correction, maximum intensity projection, 3D segmentation using cellpose and measurements using napari workflows. The pyramidal OME-Zarr files enable interactive visualization in the napari viewer. |
04/29/2023 - 10:02 | ||
| Napari: n-dimensional Python image viewer | Training Material | Recent years have shown a diversification of commonly used platforms for specific sub-domains of image analysis. Among the currently actively developed projects, napari has taken the stage as a versatile and powerful platform for the analysis of high-dimensional (3D, time-lapse) image data. |
04/29/2023 - 09:42 | ||
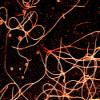
| Tracking cells in microscopy image data | Training Material | Cell tracking is a common bio-image analysis task. In this session we will learn about the basic principles behind cell tracking. We will go through cell segmentation, spot detection techniques such as Difference of Gaussian, linking, matching and will see how to do cell tracking in practice using TrackMate in Fiji. |
04/29/2023 - 09:31 | ||
|
|
Nuclei Segmentation (Stardist) | Software | Workflow | This workflow applies a Stardist pre-trained model (versatile_fluo or versatile_HE) depending on the input images ie. uses both models for a dataset including both fluorescence (grayscale or RGB where all channels are equal) and H&E stained (RGB where channels are not equal) images. This version uses tensorflow CPU version (See Dockerfile) to ensure compatibility with a larger number of computers. A GPU version should be possible by adapting the Dockerfile with tensorflow-gpu and/or nvidia-docker images. |
05/17/2023 - 16:12 |
|
|
Nuclei Segmentation (Cellpose) | Software | Workflow | This workflow processes a group of images containing cells with discernible nuclei and segments the nuclei and outputs a binary mask that show where nuclei were detected. It performs 2D nuclei segmentation using pre-trained nuclei segmentation models of Cellpose. And it was developed as a test workflow for Neubias BIAFLOWS Benchmarking tool. |
05/17/2023 - 16:13 |
|
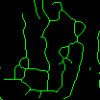
MiNA - Mitochondrial Network Analysis | Software | Workflow | MiNA is a simplified workflow for analyzing mitochondrial morphology using fluorescence images or 3D stacks in Fiji. The workflow makes use of ImageJ Ops, 3D Viewer, Skeletonize (2D/3D), Analyze Skeleton, and Ridge Detection. |
05/15/2023 - 11:42 |
|
MosaicExplorerJ | Software | Component | It stitches 3D tiles from terabyte-size microscopy datasets. Stitching does not require any prior information on the actual positions of the tiles, sample fiducials, or conversion of raw TIFF images, and the stitched images can be explored instantly. MosaicExplorerJ was specifically designed to process lightsheet microscopy datasets from optically cleared samples. It can handle multiple fluorescence channels, dual-side lightsheet illumination and dual-side camera detection. |
04/28/2023 - 17:41 |
| https://biii.eu/bioimage-data-analysis-workflows-advanced-components-and-methods | Training Material | 04/27/2023 - 10:12 | |||
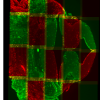
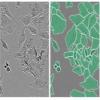
| Building a Bioimage Analysis Workflow Using Deep Learning | Training Material | This book chapter is part of this book. The aim of this workflow is to quantify the morphology of pancreatic stem cells lying on a 2D polystyrene substrate from phase contrast microscopy images. For this purpose, the images are first processed with a Deep Learning model trained for semantic segmentation (cell/background); next, the result is refined and individual cell instances are segmented before characterizing their morphology. |
04/27/2023 - 10:12 | ||
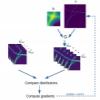
| GPU-Accelerating ImageJ Macro Image Processing Workflows Using CLIJ | Training Material | This chapter is part of this book. The chapter introduces GPU-accelerated image processing in ImageJ/Fiji. The reader is expected to have some pre-existing knowledge of ImageJ Macro programming. Core concepts such as variables, for-loops, and functions are essential. The chapter provides basic guidelines for improved performance in typical image processing workflows. |
04/27/2023 - 10:00 | ||
| Bioimage Data Analysis Workflows - Advanced Components and Methods | Training Material | This open access textbook aims at providing detailed explanations on how to design and construct image analysis workflows to successfully conduct bioimage analysis. |
04/27/2023 - 09:53 | ||
|
|
Incucyte Base Analysis Software | Software | Collection | The Incucyte® Base Analysis Software provides a guided interface and purpose-built tools, which include the process of acquiring, viewing, analyzing and sharing images of living cells. |
04/26/2023 - 18:18 |
|
|
ImageJ Threshold | Software | Component | This ImageJ function automatically or interactively sets lower and upper threshold values, segmenting grayscale images into features of interest and background. |
05/17/2023 - 16:44 |
|
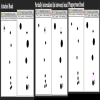
Semi-automated quantification of three stages of phagocytosi using ImageJ | Software | Workflow | The authors present an ImageJ-based, semi-automated phagocytosis workflow to rapidly quantitate three distinct stages during the early engulfment of opsonized beads. |
05/17/2023 - 16:27 |
|
FluoGAN | Software | Component | FluoGAN is a fluorescence image deconvolution software combining the knowledge of acquisition physical model with gan. It takes a fluctuating sequence of blurred, undersampled and noisy images of the sample of interest fixed sample as input from wide field or confocal and returns a super resolved image. |
03/31/2023 - 10:44 |
|
ShareLoc | Dataset | Dataset of single molecule localisation microscopy SMLM, mainly storm, d-storm, dna-paint for now. Data are mainly the localisation positions in text files, some are associated with brightfield images. https://doi.org/10.1038/s41592-022-01659-0
|
05/03/2023 - 11:11 | |
|
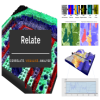
Relate | Software | Collection |
Relate is a correlative software package optimised to work with EM, EDS, EBSD, & AFM data and images. It provides the tools you need to correlate data from different microscopes, visualise multi-layered data in 2D and 3D, and conduct correlative analyses.
|
05/17/2023 - 16:38 |
|
LIVECell | Dataset | LIVECell is a manually annotated and expert-validated dataset of 2D phase contrast images, consisting of over 1.6 million cells from a diverse set of cell morphologies and culture densities. It is also associated with some trained models. All are published under CC BY-NC 4.0 license. |
03/28/2023 - 12:47 |