
Contents
| Image | Title | Category | Type | Description | Updated |
|---|---|---|---|---|---|
|
MTrackJ | Software | Component | Manual Tracking GUI. Many shortcut keys, and after being experienced, manual tracking can efficiently done. Post-editing capability to delete segments, merge and splitting tracks is quite useful. |
05/27/2018 - 17:15 |

|
FeatureJ Laplacian | Software | Component | An often used Laplacian filter for enhancing signals at object boundaries and dots. It works with XY, XYZ, XYZ-T, XYZ-T-Ch1, XYZT-C1-C2 images. Distributed as a part of ImageJ plugin FeatureJ, and included in Fiji. The second URL above is the link to its Javadoc. (imagescience.feature.Laplacian). A primer for using this class in Jython script is in CMCI Jython/Fiji cookbook: FeatureJ. |
04/25/2023 - 19:19 |
|
|
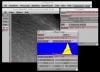
FindFoci | Software | Component | The FindFoci plugins allow the identification of peak intensity regions within 2D and 3D images. The algorithm is highly configurable and parameters can be optimised using reference images and then applied to multiple images using the batch mode. Details of the benefits of training an algorithm on multiple images can be found in the FindFoci paper: 2591 |
10/28/2019 - 12:19 |
|
|
SpotFinderM | Software | Component | Quote: *A GUI-based program which manually detects spots and places them into previously detected meshes. Currently the program runs from MATLAB only. * |
10/28/2019 - 12:12 |
|
|
SpotFinderZ | Software | Component | Quote: *SpotFinderZ (from now on simply SpotFinder) detects round, usually diffraction-limited spots inside bacterial cells outlined with MicrobeTracker and places them into the meshes structure produced by MicrobeTracker. The program is written in MATLAB and saves the data in the MicrobeTracker format by appending additional fields.* |
10/21/2019 - 14:54 |
|
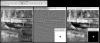
ImageJ Bandpass filter | Software | Component | The Fourier transform of an image produces a representation in frequency space: i.e. separated according to spatial frequency (effectively scale). The 2D amplitude map of the different spatial frequencies is symmetrical, and is commonly displayed with low spatial frequencies (large features) in the centre, highest spatial frequencies (small features) at the edges. Fourier filtering involves suppressing or enhancing features in the Fourier domain before carrying out an inverse Fourier transform to obtain a filtered real-space image. |
10/28/2019 - 12:42 |
|
PRIISM/IVE | Software | Collection | Defunct collection — no longer provided or supported. Legacy description follows: |
10/27/2025 - 04:16 |
|
|
ICS tools | Software | Collection | Implementation of some image correlation spectroscopy tools |
05/02/2023 - 13:23 |
|
Microscope Image Correlation Spectroscopy MICS | Software | Component | Fluorescence spectroscopy by image correlation is a technique that allows analysing and characterizing the different molecular dynamics from a sequence of fluorescence images. Many image correlation techniques have been developed for different applications but in particular to study the mechanisms of cell adhesion during migration. These techniques can be used with most imaging modalities: e.g. fluorescence widefield, confocal microscopy, TIRFM. |
10/24/2024 - 14:23 |
| |
2D and 3D tracking based on global cost function optimization | Software | Workflow | 04/27/2023 - 17:15 | |

|
Root tools | Software | Workflow | The root tools help to efficiently measure the following characteristics of plant roots: the angle of the opening of the whole root the depth to which it goes down the number of roots at multiple depths (for example 30cm, 35cm, ...) the diameters of the roots at multiple depths (for example 30cm, 35cm, ...) |
05/03/2018 - 14:56 |

|
SLOTH | Software | Collection | A collection for tracking microtubule dynamics, written in Python. |
05/03/2023 - 10:53 |

|
HDF5 plugin for Fiji and ImageJ | Software | Component | HDF5 is a data format for storing extremely large and complex data collections. This Fiji/ImageJ HDF5 plugin saves and loads 2D - 5D datasets with flexible options. In Fiji, the plugin is downloadable via update site "HDF5". |
05/25/2018 - 18:34 |
|
Visiopharm | Software | Collection | The software is designed for pathologists. Image analysis protocols are built from graphical user interfaces; there is no need for programming experience or an extensive training program. Cloud and deployed solutions are available. Visiopharm can be employed to develop workflows (apps) for the user. Modular structure with multiple packages: VisiomorphDP TissuemorphDP Arrayimager Tissuealign Visiomorph Tissuemorph Microimager Fluoimager |
09/13/2017 - 12:15 |

|
Colony Blob Count Tool | Software | Workflow | Count bacterial colonies on agar plates and measure the occupied surfaces. The user has to provide a selection (roi) of the area that will be analyzed. He can than run the segmentation and if necessary correct the results. In a third step he can run the counting and measurement. |
05/29/2018 - 02:35 |

|
PhenoRipper | Software | Collection | An easy to use, image analysis software package that enables rapid exploration and interpretation of microscopy data. |
04/28/2023 - 17:00 |
|
Kymoquant | Software | Component | Measurement of kymograph generally deals with slanted streaks in kymograph to measure velocity of movements. This is a pretty much manual procedure that needs hands-on work. Kymoquant analyzes kymograph by treating patterns appearing in kymograph as texture: for a specified area in kymograph, it detects the most likely orientation of streaks and outputs this result as velocity. This workflow was created to ease the situation when it is difficult to find major direction of streaks only with eyes. |
05/29/2018 - 02:40 |
|
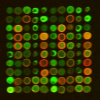
DNA MicroArray Image Processing Case Study | Software | Workflow | In this case study, MATLAB, the Image Processing and Signal Processing toolboxes were used to determine the green intensities from a small portion of a microarray image containing 4,800 spots. A 10x10 pattern of spots was detected by averaging rows and columns to produce horizontal and vertical profiles. Periodicity was determined automatically by autocorrelation and used to form an optimal length filter for morphological background removal. A rectangular grid of bounding boxes was defined. Each spot was individually addressed and segmented by thresholding to form a mask. |
05/30/2018 - 00:36 |

|
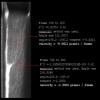
Correct 3D drift | Software | Component | Rigid registration of time series in 3D. A video tutorial is available (be careful of sounds, the video automatically starts!): [Sample Drift Correction Following 4D Confocal Time-lapse Imaging](http://www.jove.com/video/51086/sample-drift-correction-following-4d-co…) |
03/03/2020 - 12:30 |
|
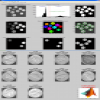
MATLAB Image Segmentation Tutorial | Software | Component | 05/30/2018 - 00:44 |