Colocalisation analysis

Synonyms
Colocalization analysis
Co-localisation analysis
Description

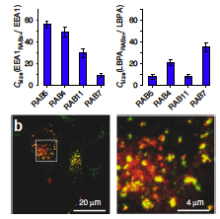
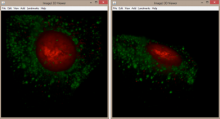
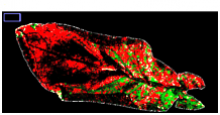
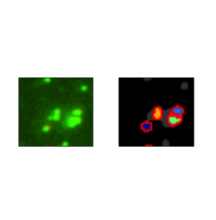
A workflow template to analyze subcellular structures in fluorescence 2D/3D microscopy images based on a Fiji plugin **Squassh** is described in Rizek et al (2014).

The workflow employs detecting, segmenting, and quantifying subcellular structures. For segmentation, it accounts for the microscope optics and for uneven image background. Further analyses include both colocalization and shape analyses. However, it does not work directly for time-lapse data. A brief summary note can be found here.

Description

The workflow computes cell-based colocalisation of two stainings in 2-D images. Both pixel- and object-based readouts are provided and some pros and cons are discussed. Please read here for more information:

https://github.com/tischi/ImageAnalysisWorkflows/blob/master/CellProfil…


Input data type: 

images

Output data type: 

processed images, numbers, text file, csv files

Description

These two similar KNIME workflow solutions take 3D data stacks to segment the spots first, using local thresholding with subsequent morphological operations in order to remove noise. Colocalization is then defined by overlapping or center point distance between segmented objects. Further filtering such as overlapping ratio or distance range is done through KNIME table processing.

Two different types are available. 

  1. colocalization based on overlapping
  2. colocalization based on distance between object centers

Sample images: Smapp_Ori files

Chapter 4 in the documentation. 

Description

The Leaf Infection Tools allow to measure the area of leaves, of two stainings in different channels and of the overlap region of the two stainings. 

See: http://dev.mri.cnrs.fr/projects/imagej-macros/wiki/Leaf_Infection_Tools

Test image: http://biii.eu/node/1143

a leaf with infection pattern
Description

Quote:

Measuring the colocalization between fluorescently labeled molecules is a widely used approach to measure the degree of spatial coincidence and potential interactions among subcellular species (e.g., proteins). This example shows how the object identification and RelateObjects modules are used to measure the degree of overlap between two fluorescent channels. Sample image is included in the download package.