Description
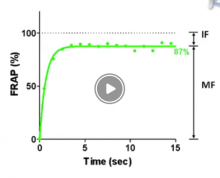
Very simple application that lets you load your time-lapse intensity data to generate the normalized FRAP recovery curve and perform exponential curve fitting.
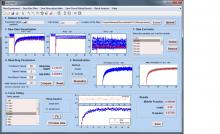
Quote: The user can handle simultaneously large data sets of raw data, visualize fluorescence recovery curves, exclude low quality data, perform data normalization, extract quantitative parameters, perform batch analysis and save the resulting data and figures for further use. Our tool is implemented as a single-screen Graphical User Interface (GUI) and is highly interactive, as it permits parameterization and visual data quality assessment at various points during the analysis.