Workflow

Description

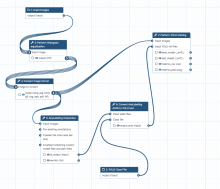
This workflow is the integration of YOLO (You Only Look Once) machine learning models, image pre-processing scripts and labeling tools within the Galaxy platform. Galaxy is an open, web-based platform used primarily for data analysis in computational biology, but it also has applications in image processing and other fields. 

How the Galaxy YOLO image segmentation tool works

The combination of Galaxy and YOLO allows researchers to perform object detection and image analysis without requiring extensive programming knowledge. Here's how it generally works: 

  • Web-based interface: Galaxy provides a graphical, user-friendly interface to access powerful analysis tools. Users can simply upload their image data, select the YOLO tool, and run the analysis.
  • YOLO model execution: The Galaxy tool executes a pre-trained YOLO model, often from the Ultralytics framework, on the input images. These models can perform tasks like object detection (drawing bounding boxes) or instance segmentation (creating pixel-level masks).
  • Training and prediction: Some tools allow for both model training and prediction. Users can train a custom YOLO model on their own labeled datasets to detect specific objects of interest. For example, bioimage analysis may involve detecting cells or other structures.
  • Other integrations: Other machine-learning tools can be integrated with YOLO in Galaxy. For instance, the AnyLabeling tool supports YOLO for semi-automated and active learning-based data annotation. 
Description

ImageJ macro script to streamline the original NMJ-morph methodology doi:10.1098/rsob.160240
Also requires Binary Connectivity https://blog.bham.ac.uk/intellimic/g-landini-software/ 

has function
need a thumbnail
Description

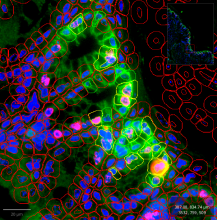
Scripts that allow to automatize  a multiplex analysis in qupath. The input is a multi channel image with one channel containing a staining of cell nuclei and the other channels containing markers for a specific molecule. The goal is to obtain a count of positive cells for the markers in the different channels and for the combinations of positive markers. The workflow also adds the total numbers of positive cells for each marker to the results table (cells positive for multiple markers are not counted positive for the individual markers in the original qupath result).

cells positive for different markers in different channels
Description

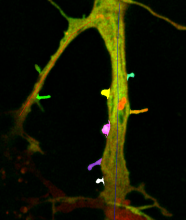
Spine Analyzer allows to semi-automatically segment dendritic spines in 3D+t images and to measure their volumes and the intensities of the signal within in different channels over time.

Neurites with segmented dendritic spines
Description

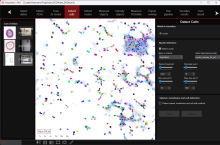
HistoMetriX is a quantitative histology and digital pathology image analysis software designed for biomedical research. It enables automated and AI-assisted analysis of brightfield and fluorescence microscopy images, including whole-slide images and tissue microarrays.

HistoMetriX combines deep-learning-based tissue segmentation with cell detection and classification, quantitative morphology and intensity measurements, biomarker quantification, and spatial analysis. Custom AI models can be trained to identify tissue structures and biological phenotypes specific to a study.

The software provides interactive visualization and validation of analysis results and is designed to support reproducible quantitative workflows for applications including oncology, immunology, dermatology, toxicology and biomedical research. Research use only.

HistoMetriX software for AI-powered histology and digital pathology image analysis